Maps
The Maps page provides infrastructure discovery visualization: mapping the relationships between domains, IP addresses, and hosting infrastructure used by scam operations. A single discovered domain often reveals an entire cluster of related fraud sites run by the same actor.
What infrastructure discovery does
When you run a map on a suspicious domain, the Maps engine:
- Resolves the domain's DNS records (A, AAAA, CNAME, NS, MX)
- Reverse-looks up other domains hosted on the same IP address
- Checks the SSL certificate's Subject Alternative Names (SANs) for co-hosted domains
- Scans for related domains by registrar, nameserver pattern, or registration timing
- Applies WHOIS enrichment to identify registration patterns across the cluster
- Builds an interactive graph of the entire hosting cluster
This reveals the full scope of a scam operation's infrastructure: a single phishing URL typically shares infrastructure with dozens of other fraud domains run by the same operator.
Reading a map
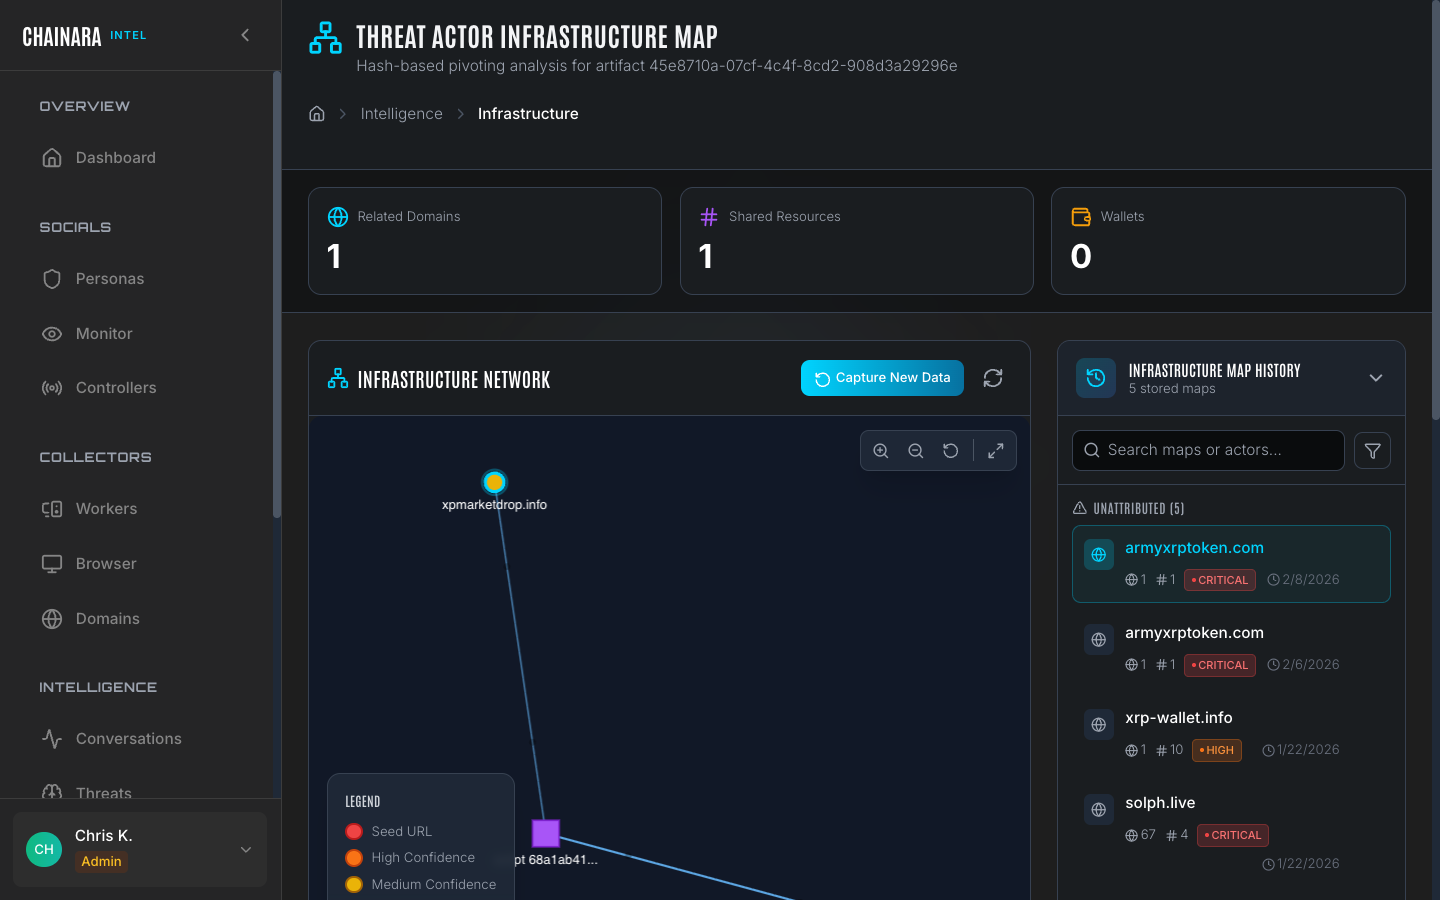
Each map is rendered as an interactive node-link graph:
| Element | Description |
|---|---|
| Central node | The initial domain or IP you investigated |
| Domain nodes | Other domains discovered through the infrastructure relationships |
| IP nodes | Hosting servers that connect multiple domains |
| Edge labels | The relationship type connecting two nodes (same IP, same cert SAN, same registrar, same nameserver) |
Node color coding
| Color | Risk level | Meaning |
|---|---|---|
| Red | CRITICAL | Confirmed phishing or fraud infrastructure |
| Orange | HIGH | Likely malicious based on scoring |
| Yellow | MEDIUM | Suspicious: warrants investigation |
| Gray | Unknown | Not yet scored or analyzed |
You can click any node in the map to open the Domain Detail Drawer, with five tabs covering everything Chainara knows about that domain. Use zoom, pan, and fullscreen to navigate large infrastructure clusters; an a11y-aware toolbar provides keyboard alternatives for every gesture.
Domain Detail Drawer
Clicking a domain node opens a side drawer with the following tabs:
| Tab | Contents |
|---|---|
| Overview | Risk score, hosting provider, WHOIS, certificate, registration timing |
| Network | Direct neighbors and the relationships connecting them (IP, NS, cert SAN, registrar) |
| Wallets | Crypto wallets observed on this domain across all worker scans |
| Actors | Threat actors and campaigns this domain has been attributed to |
| Sessions | Past worker scan sessions with timestamps, threat verdicts, and links to the originating reports |
Drawer reads are cached, so opening the same node twice in quick succession is instant.
Cross-pivot
Inside the drawer, click any pivot button to find every other domain that shares a given attribute:
- Same IP address
- Same ASN (hosting provider)
- Same registrar
- Same certificate issuer
- Same nameserver
Cross-pivot turns a single domain into a starting point for hunting an entire infrastructure cluster. This is useful when an operator rotates IPs but leaves a registrar or cert issuer fingerprint constant.
Right-click context menu
Right-click any node (domain, IP, script hash, or wallet) for quick actions:
- Tag with Campaign or Tag Threat Actor: opens the tagging modal seeded with the artifact ID, so you can attribute discovered infrastructure to a known operation in one step
- Pivot, copy, or open in a new tab
Tor routing for .onion infrastructure
When a map includes .onion nodes (for example, a clearnet phishing site that mirrors itself on a hidden service), the discovery worker routes those resolutions through Tor, the same way Dark Web Hunter does. Your platform's IP is never exposed to dark-web infrastructure during enrichment.
Composite graphs across shared URL patterns
When a group of domains is held together only by a shared URL pattern (for example, /to-participate appearing across six different domains), the composite map links the sub-clusters explicitly instead of rendering each domain's local infrastructure as a disconnected island. URL-pattern edges are styled distinctly so they're easy to tell apart from infrastructure relationships.
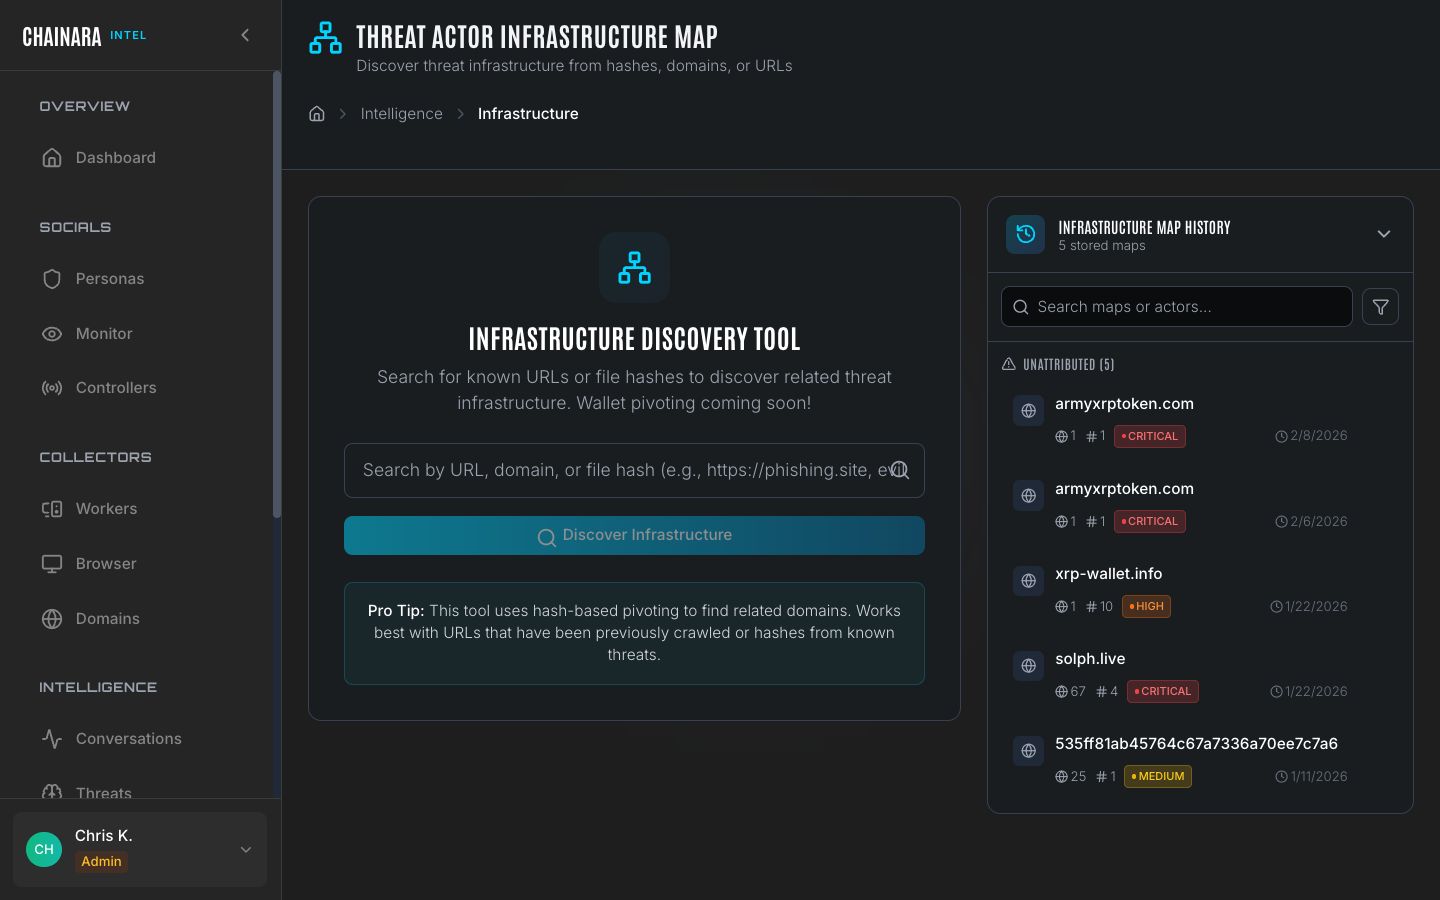
Running a new map
- Click New Map in the top right
- Enter a domain name or IP address as the starting point
- Set the discovery depth (1–3 hops):
- 1 hop: only direct relationships of the seed domain
- 2 hops: relationships of the seed and its first-degree neighbors
- 3 hops: full extended cluster; use sparingly on large hosting providers
- Click Discover
- The worker crawls the infrastructure graph and renders the interactive map
- Click Save Map to store the result for future reference and sharing
Start with depth 1 to get a fast result, then re-run at depth 2 if the initial map reveals interesting neighbors. Running at depth 3 against a shared hosting IP can return hundreds of nodes and take significantly longer.
Stored maps
Previously run maps are listed on the Maps page. Each stored map entry shows the seed domain, risk level, number of nodes discovered, and the date it was run. You can re-open any stored map to interact with the visualization, compare it against a more recent run, or reference it in a report.
Use cases
| Use case | How to use maps |
|---|---|
| Attribution | Identify all domains run by the same scam operator by following shared infrastructure |
| Takedown campaigns | Get the complete list of domains in a cluster to include in abuse reports and blocking requests |
| Proactive detection | When a new domain appears on known bad infrastructure (an existing node's IP), pre-flag it before it launches |
| Law enforcement | Provide complete infrastructure evidence with node relationships and WHOIS data in LE reports |