Network Flow
The Network Flow page renders an interactive graph of wallet relationships and transaction connections on the XRP Ledger.
What It Shows
The network graph displays:
- Wallets as nodes: sized by transaction volume
- Transactions as edges: connecting sender and receiver
- Risk coloring: red for high-risk, yellow for medium, green for benign
- Cluster detection: visually groups wallets that transact frequently with each other
Interacting with the Graph
| Action | How |
|---|---|
| Pan | Click and drag the canvas |
| Zoom | Scroll wheel or pinch |
| Select a node | Click a wallet node to see its details |
| Expand | Double-click a node to load its connected wallets |
| Filter | Use the top controls to filter by risk level or date range |
| Reset | Click Reset to return to the default view |
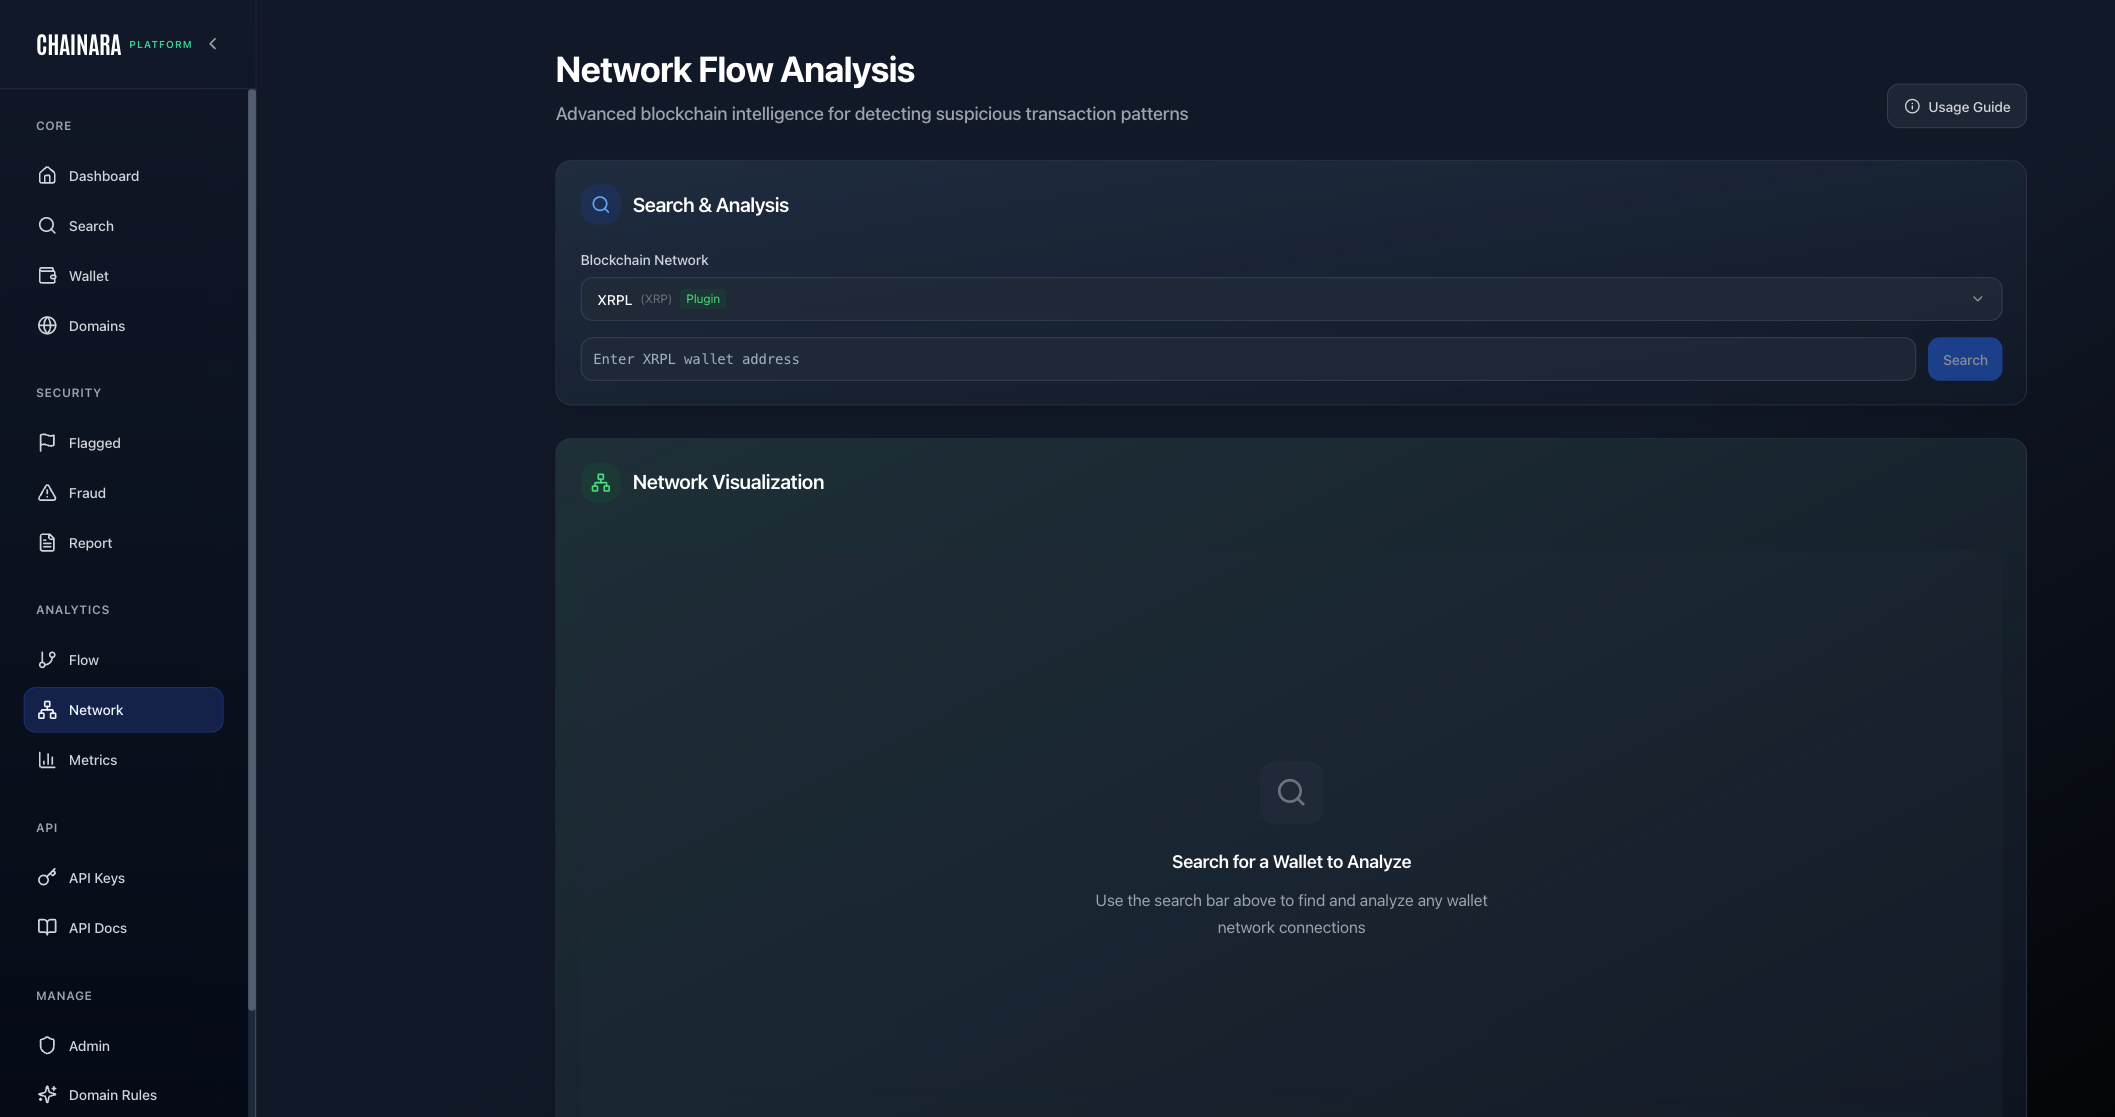
Starting a Network Investigation
- Enter a wallet address in the search box at the top
- Click Load Network: this loads the wallet and its direct connections
- Expand nodes of interest by double-clicking
- Use the risk filter to hide low-risk nodes and focus on suspicious connections
- Click any node to view that wallet's full analysis in the side panel
Exporting the Graph
- Click Export PNG to save the current graph view as an image
- Click Export JSON to download the raw node/edge data for further analysis
tip
Network Flow is most powerful when investigating a cluster of related scam wallets. Start from a known fraud wallet and expand outward to discover the full operation's wallet network.