Metrics
The Metrics page provides enterprise-level analytics on the platform's fraud prevention impact over time.
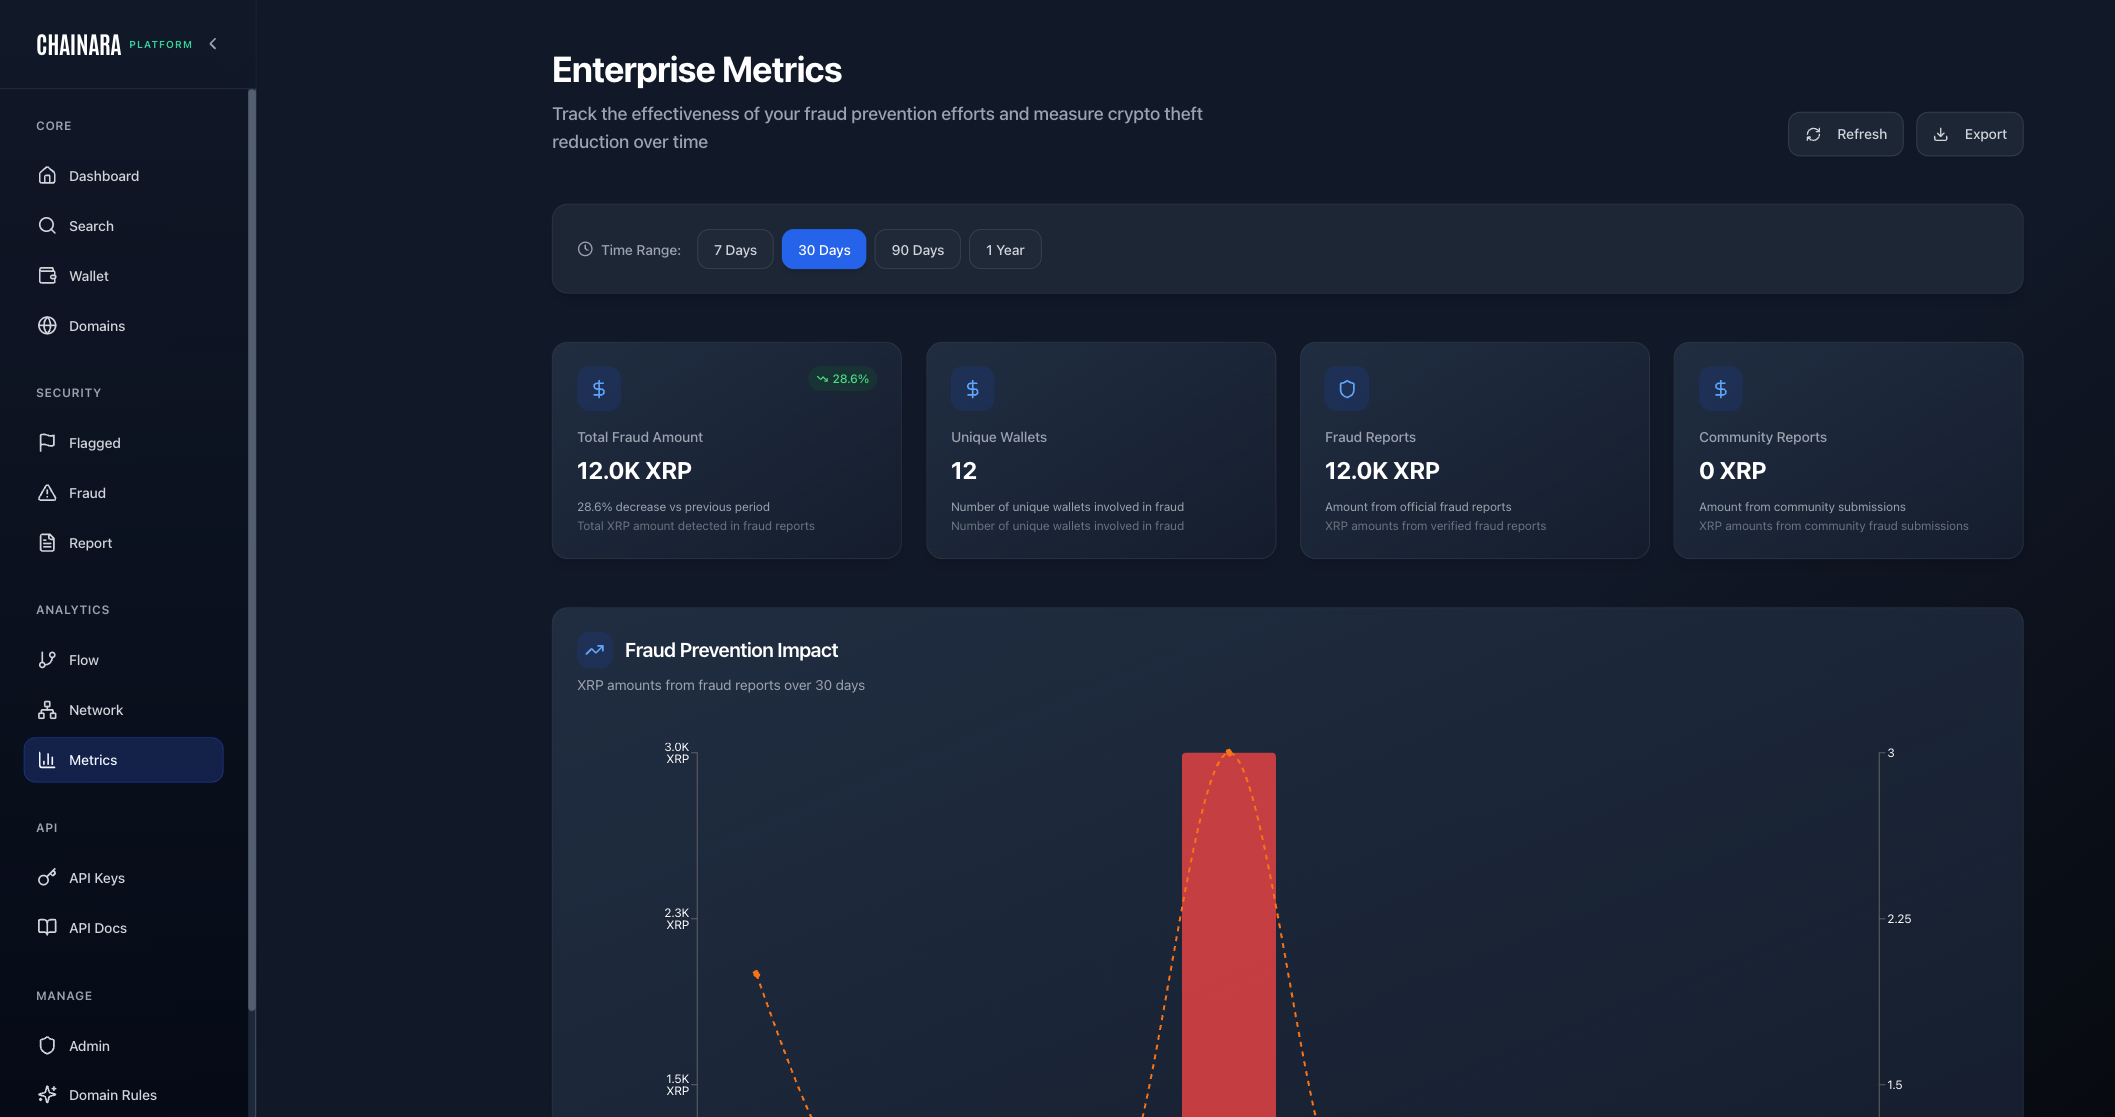
Overview Stats
The top stat cards show cumulative totals for your organization's selected date range:
| Metric | Description |
|---|---|
| Total XRP Fraud Detected | Total XRP amount (in XRP, not USD) linked to verified fraud reports |
| Unique Wallets Flagged | Distinct wallets identified as fraudulent |
| Fraud Prevention Impact | Visual trend of fraud activity over the selected period |
Fraud Prevention Impact Chart
The 30-day chart visualizes fraud detection activity over time, showing:
- Daily/weekly fraud report volume
- Spikes indicate periods of increased scam activity (e.g., coordinated airdrop scams)
- The trend line helps you assess whether fraud is increasing or being successfully suppressed
Use Cases
- Executive reporting: screenshot the metrics for leadership summaries
- Trend analysis: identify seasonal patterns in XRP scam activity
- ROI calculation: quantify the value of the platform in XRP and USD terms
- Compliance documentation: demonstrate fraud prevention activity to regulators
Date Range
Use the date range selector to adjust the reporting window:
- Last 7 days
- Last 30 days (default)
- Last 90 days
- Custom range